Andrew Luyt’s Projects
Last updated 2023-09-16
I’m a data analyst in Vancouver, Canada, and these are my public projects.
1. AI-Assisted Exercise

I built an AI model that can check if a person’s form is incorrect during weightlifting, using data from a wearable smart device.
2. A brief analysis: Vancouver’s Mobi Bikeshare
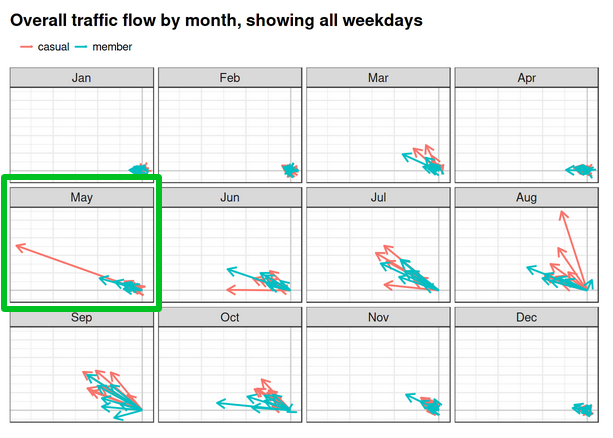
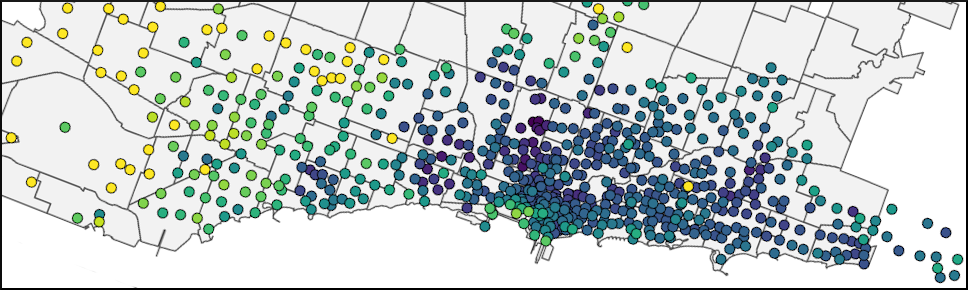
Three visualizations are prepared to quickly demonstrate traffic flow, station usage, and seasonal ride variation for the bike sharing network.
3. Detailed analytics: Chicago’s Divvy Bikeshare
Using a dataset of over four million bicycle rides, traffic volume and flow patterns are visualized, and the differences between yearly members and casual users are explored. The data are explored in much more detail than in the Mobi analysis.
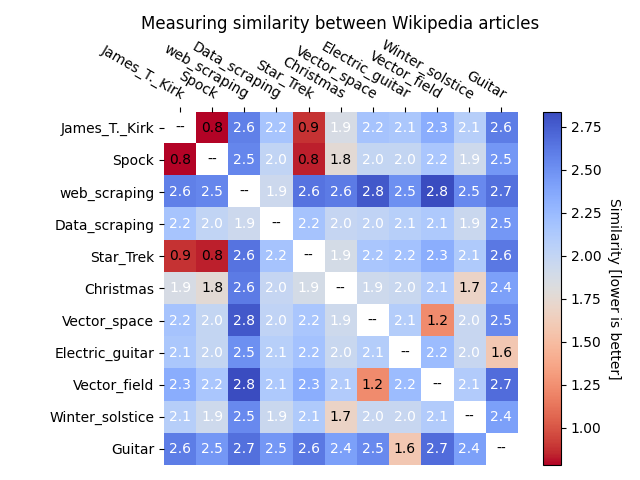
4. Discovering similar documents with linear algebra
Computing numeric similarity between text documents on Wikipedia. Two linear algebra-based techniques are discussed and implemented
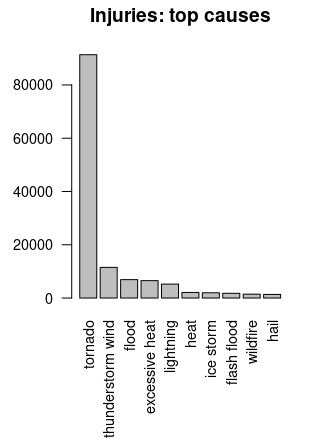
5. Destructive Weather Events, 1950-2011
Extensive data cleaning of an old NOAA dataset is required to discover the most costly types of weather events in the USA, in terms of human and financial damage. Done as a final project in the Johns Hopkins course Reproducible Research, it is presented with inline R code.
6. Evidence for social unrest in a bicycle use dataset
Exploratory visual data analysis of the Divvy dataset leads to a surprising signal hiding in the data. Hosted on Kaggle.com as a notebook.